Will discuss system flow chart, data flow diagram and E R diagram in this blog.
System Flow Chart
The system flow chart is a visual representation of all processed in sequential order.
The System flow chart diagram is a graphical representation of the relation between all the major parts or step of the system.
Flow chart diagram can not include minor parts of the system.
Flow Chart Symbols
DFD
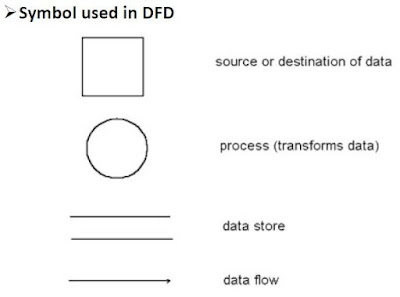
A data flow diagram (DFD) is a graphical representation of the "flow" of data through an information system, modeling its process aspects.
A DFD is often used as a preliminary step to create an overview of the system
DFD draw for process wise or user wise.
There are different level of DFD
1.0 Context level Diagram (Level “0”)
1.1 First level DFD (Level “1”)
1.1.1 Second Level DFD (Level “2”)
Note: no more than seven levels
College Management system is useful for Students and Staffs because Staffs upload materials, fill-up student attendance online.
Also student can view online attendance, course details, result etc. Also download materials. and Admin generate different reports.
College Management System provides one attractive environment where you can manipulate data and information about students and staff easily.
College Management System is to manage the task related to the college students/staff and to reduce time to searching of appropriate candidates in college view.
This system provides the detail structure of the institute campus and its departments.
It will support both stand alone and also networking environment.
Basicallly There are three types of User of College Mangement System.
1) Admin: Manage the overall system.
2) Staff: Registration, Manage his/her profile, Upload/Download Content, Fill-up Student Attendance, Add Result, Add News, Give response to Inquiry or Feedback etc.
3) Student: Registration, Manage his/her profile, Download Materials, View Attendance, View Result, View News, Give Inquiry or Feedback etc.
Below figure shows System Flow Chart of College Management System
First level DFD
Continue in the second page
Define how to prepare a second-level DFD under the main process.
If the main process is event, and there are different sub-processes under the event process.
ER Diagram
ER Diagram stands for Entity Relationship Diagram, also known as ERD is a diagram that displays the relationship of entity sets stored in a database.
In other words, ER diagrams help to explain the logical structure of databases.
ER diagrams are created based on three basic concepts: entities, attributes and relationships.
ER Diagrams contain different symbols that use rectangles to represent entities, ovals to define attributes and diamond shapes to represent relationships.
Components of the ER Diagram
This model is based on three basic concepts:
- Entities
- Attributes
- Relationships
Data Dictionary
• A Data Dictionary is a collection of names, definitions, and attributes about data elements that are being used or captured in a database, information system, or part of a research project.
• A Data Dictionary also provides metadata about data elements.
• it is only handled by the database administrators.
• Following format of data dictionary describing a table that contains details of tables.
• Here, i have add registration table and login table for your reference. that means how to prepared data dictionary of system or project.
Faculty registration table
Login table
Try to different case study for self study
• Railway Reservation System
• Online Examination System
• Library Management System
• Payroll Management System or Employee Payroll System
• Hospital Management System
• Financial Accounting System
• Sales & Marketing System (Billing System)
• Online shopping Management System
• Student Attendance system
• Food Ordering System
• Online Teaching System
• Job Portal sysyem
• Student Management System
• Matrimonial Website System
• Society Management System
------------------------------------------------------------------------------------------------------
Or follow my blog from the link below
Also, Join my Telegram channel with the below link
Also, join my Whatsapp group with the below link


0 Comments