In this blog, We have discussed the different important topics of Excel and many more...
What is a chart?
• Charts are used to summarize and visualize your data graphically.
Graphical representation of data using charts makes complex data analysis easier to understand.
What is the Goal Seek function?
• The Goal Seek Excel function (often referred to as What-if-Analysis)
• is a method of solving for a desired output by changing an assumption that drives it.
• The function essentially uses a trial and error approach to back-solving the problem by plugging in guesses until it arrives at the answer.
How can one use Solver in Excel?
•A solver is a mathematical tool present in MS Excel
• that is used to perform calculations by working under some constraints/conditions and then calculates the solution for the problem.
• It works on the objective cell by changing the variable cells by using sum constraints.
• Solver is present in MS Excel but to use it we need to activate it
What is a hyperlink? OR How do you create hyperlinks in Excel?
• For quick access to related information in another file or on a web page,
• you can insert a hyperlink in a worksheet cell.
• You can also insert links in specific chart elements
• Use the 'Insert Hyperlink ' dialog box in Excel to create a hyperlink to an existing file, a web page, or a place in this document.
• You can also use the HYPERLINK function
What is Macro?
• If you have tasks in Microsoft Excel that you do repeatedly,
• you can record a macro to automate those tasks.
• A macro is an action or a set of actions that you can run as many times as you want.
• When you create a macro, you are recording your mouse clicks and keystrokes.
• After you create a macro, you can edit it to make minor changes to the way it works.
What is a Sparkline?
• A sparkline is a tiny chart in a worksheet cell that provides a visual representation of data.
• Use sparklines to show trends in a series of values, such as seasonal increases or decreases, economic cycles, or to highlight maximum and minimum values.
• Position a sparkline near its data for the greatest impact Prepared.
What is a Scenario Manager?
• Scenario manager in Excel is a part of three what if analysis tools in Excel, which are built in in, excel.
• In simple terms, you can see the impact of changing input values without changing the actual data
• Scenario Manager in Excel allows you to change or substitute input values for multiple cells (maximum up to 32).
• Data --> what-if analysis --> Scenario manager
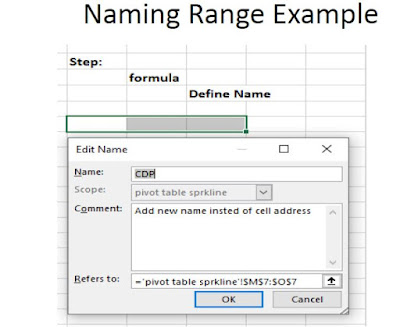
What is a Naming Range?
• In Excel, you can name a cell or a range of cells.
• Now, instead of using the cell reference (such as A1 or A1:A10),
• you can simply use the name that you assigned to it.
• Go to Formulas ––> Define
• In the New Name dialogue box, type the Name you wish to assign to the selected data range.
• Click OK.
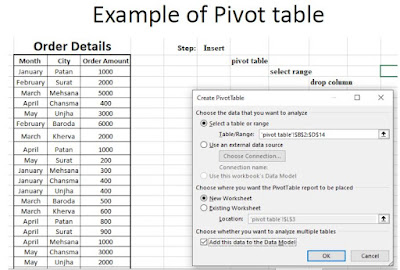
What is a Pivot table?
• A Pivot Table to summarize, analyze, explore, and present summary data.
• A pivot table is like a summary table of the dataset that enables you to create reports and analyze trends.
• They are useful when you have long rows or columns that hold values you need to track
• also allow you to easily see comparisons, patterns, and trends.
• Insert --> Pivot Table
Step of Pivot table
• Arrange the data into rows and columns
• The first row should contain a unique heading for each of the columns
• The columns should have only one type of data
• Rows must have data for a single recording only
• No blank rows
• Columns should not be completely blank
• The data for creating the Pivot table should be separate from other data present in the sheet.
Features of Pivot table
• Allow the display of exact data you have to analyze
• Provide various angles to view the data
• Allow you to focus on important details
• Comparison of data is very handy
• Pivot tables can detect different patterns, relationships, data trends, etc.
• They can create instant data
• Accurate reports
• can be based on any field such as sales, averages, sums, etc.
• Serve as the base for Pivot charts.
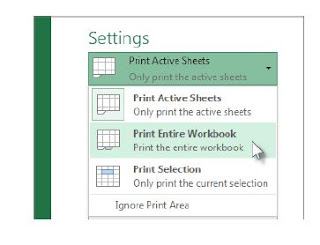
Setting options while printing a workbook or worksheet.
• You can print entire or partial worksheets and workbooks, one at a time, or several at once
• And if the data that you want to print is in a Microsoft Excel table, you can print just the Excel table.
Freeze Panes
• Freeze panes that will help you see the headings of the rows and the columns even if scroll down a long way on the sheet.
• To Freeze Panes in Excel, follow the given steps:
• First, select the Rows and Columns you wish to freeze
• Then, select Freeze Pane present in the View tab
How do you create dropdown lists?
• To create dropdown lists,
• follow the given steps:
• Click on the Data tab present in the ribbon
• Then, from the Data Tools group, click on Data Validation
• Navigate to Settings> Allow> List
• Select the source list array
Download the link for more details: Excel: Most important Topics
----------------------------------------------------------------------------------------------------------
Or follow my blog from the below link
Also, Join my Telegram channel with the below link
Also, join my Whatsapp group with the below link


0 Comments